Value Chain Analysis Template
Understand the value your business has delivered to your customers with the value chain analysis template.
Trusted by 65M+ users and leading companies


About the Porter’s Value Chain Model (aka Value Chain Analysis template)
Commonly known as the Value Chain Analysis, Porter’s Value Chain Model is a much-used method to evaluate a business’s competitive edge and improve processes to have fewer bottlenecks and add more value to your customers.
What is a value chain analysis template?
A value chain analysis template includes a set of activities a company performs to deliver a valuable product from start to finish. The analysis allows your team to visualize all the business activities involved in creating the product — and helps you identify inefficiencies, bottlenecks, and miscommunications within the process.
Create your own value chain analysis template
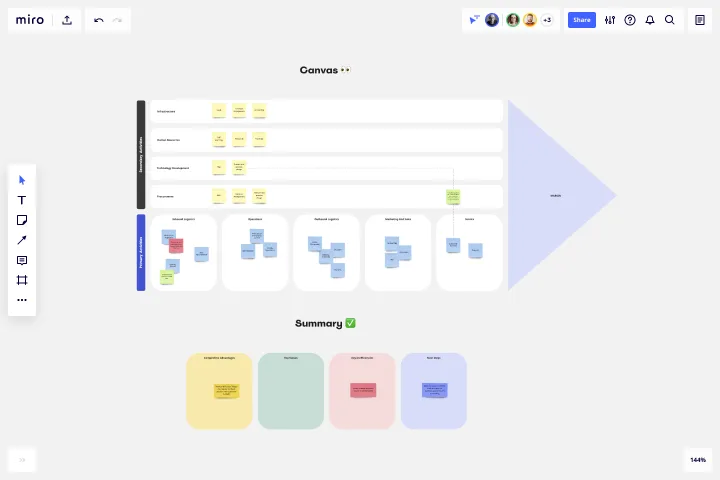
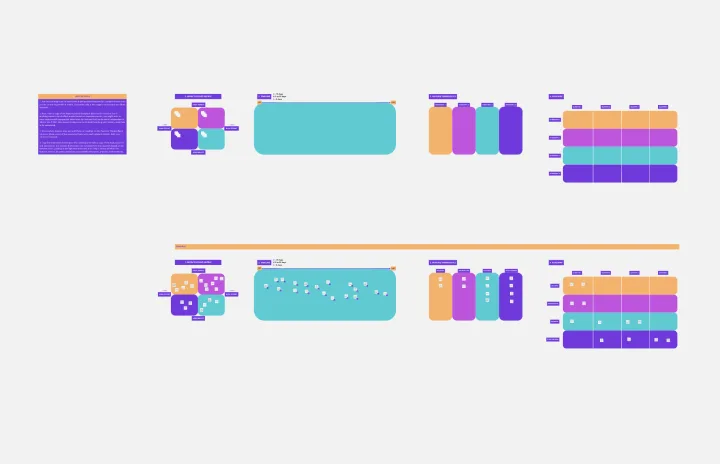
Getting started with your team’s value chain analysis template is easy with Miro. Simply click “Use Template” and take the following steps to customize it for your own value chain analysis template:
Step 1: Replace the canned text in the orange squares and blue lines with your business’s specific primary and support business activities.
Step 2: Use sticky notes to map out the process for each business activity.
Step 3: Identify where bottlenecks occur and find areas where you can maximize value and gain a competitive advantage.
Make sure to consider using Miro's Value Stream Mapping tool during this process. This framework can help improve the efficiency of a specific process, which can then be integrated into a broader Value Chain Analysis to optimize the overall value delivery of the organization.
Benefits of using a value chain analysis template
First coined by Harvard Business School professor Michael Porter, Porter’s Value Chain Model helps your team evaluate your business activities so you can find ways to improve your competitive advantage. The value chain analysis will also help you determine costs, find activities that add the most value, outshine your competitors, and improve the value of what you deliver to your customers.
Building a product can be costly in terms of both time and resources. Even worse, it can be almost impossible to know whether a process works until after you’ve tried it. Porter’s Value Chain Model helps you visualize more complex or intangible processes.
Every business should perform this analysis at some point. Your team can do this anytime you want to improve your competitive advantage taking the following steps:
Define your business’s primary activities (e.g. logistics, operations, marketing).
Define your business’s support activities (e.g. HR, infrastructure, tech).
Analyze the cost and value of each.
Discover opportunities that allow you to gain a competitive advantage.
How do you draw Porter's value analysis?
You can build your Porter’s Value Chain Model following these steps: - Map all activities involved in producing your product - Calculate the cost of each activity - Find out what do your customers perceive as value - Check competitors Porter’s Value Chain Model and benchmarks - Choose what’s your competitive advantage and where will you capitalize
How do you analyze a value chain?
After building your value chain analysis template, you can evaluate the links between each activity and its values. This value chain analysis is particularly crucial when increasing competitiveness as it will determine how to proceed to improve processes.
How do you write a value chain analysis?
You can write your value chain analysis determining which activities are to be optimized. The analysis should include quantitative and qualitative data to help you develop action points to increase your product’s added value and customer base. After your value chain analysis is ready, you can draw a business case to implement changes and help you prioritize.
Get started with this template right now.
Kano Model Template
Works best for:
Desk Research, Product Management, Prioritization
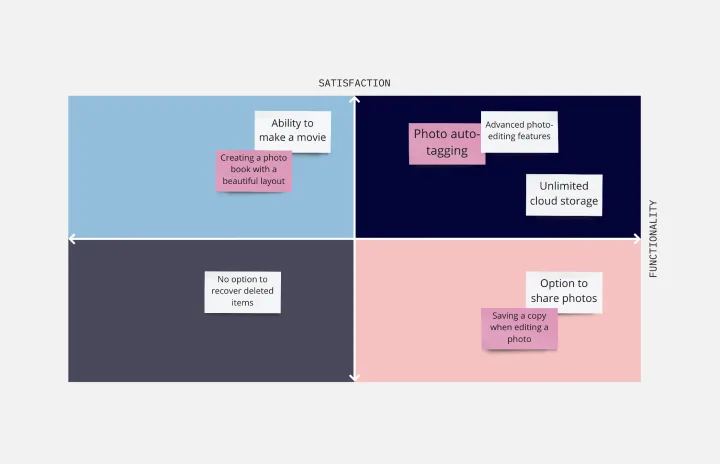
When it comes down to it, a product’s success is determined by the features it offers and the satisfaction it gives to customers. So which features matter most? The Kano model will help you decide. It’s a simple, powerful method for helping you prioritize all your features — by comparing how much satisfaction a feature will deliver to what it will cost to implement. This template lets you easily create a standard Kano model, with two axes (satisfaction and functionality) creating a quadrant with four values: attractive, performance, indifferent, and must-be.
Ansoff Matrix Template
Works best for:
Leadership, Operations, Strategic Planning
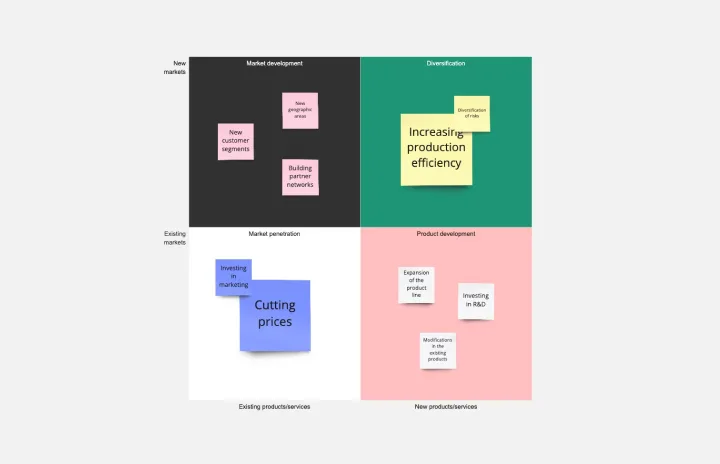
Keep growing. Keep scaling. Keep finding those new opportunities in new markets—and creative new ways to reach customers there. Sound like your approach? Then this template might be a great fit. An Ansoff Matrix (aka, a product or market expansion grid) is broken into four potential growth strategies: Market Penetration, Market Development, Product Development, and Diversification. When you go through each section with your team, you’ll get a clear view of your options going forward and the potential risks and rewards of each.
REAN Template
Works best for:
Marketing, Strategic Planning, Meetings
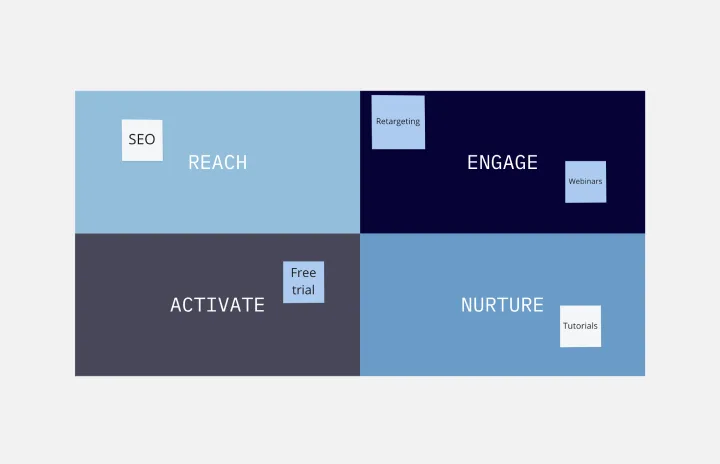
First introduced in Cult of Analytics, the REAN model is used to measure and understand the efficacy of marketing efforts. REAN stands for Reach, Engage, Activate, and Nurture, the main stages a marketer’s audiences experience during a typical journey. The REAN model helps marketing teams develop useful KPIs that can help capture how well their marketing or ad campaigns are working. Many teams rely on the REAN model because it is adaptable to a variety of marketing efforts, including planning measurement frameworks, setting goals, deciding on objectives, and mapping digital marketing channels.
Ansoff Matrix Template
Works best for:
Leadership, Operations, Strategic Planning
Keep growing. Keep scaling. Keep finding those new opportunities in new markets—and creative new ways to reach customers there. Sound like your approach? Then this template might be a great fit. An Ansoff Matrix (aka, a product or market expansion grid) is broken into four potential growth strategies: Market Penetration, Market Development, Product Development, and Diversification. When you go through each section with your team, you’ll get a clear view of your options going forward and the potential risks and rewards of each.
Project Planning Template
Works best for:
Project Management, Project Planning
A project plan is a single source of truth that helps teams visualize and reach project milestones. Project plans are most useful when you outline the project’s “what” and “why” to anyone who needs to give you project buy-in. Use a project plan to proactively discuss team needs; expectations; and baselines for timeline, budget, and scope. The plan will also help you clarify available resources before you kick off a project, as well as expected deliverables at the end of the project.
Epic & Feature Roadmap Planning
Epic & Feature Roadmap Planning template facilitates the breakdown of large-scale initiatives into manageable features and tasks. It helps teams prioritize development efforts based on business impact and strategic objectives. By visualizing the relationship between epics and features, teams can effectively plan releases and ensure alignment with overall project goals and timelines.